pretix Hosted outage post-mortem
Yesterday, we experienced one of the most significant outages in the history of our pretix Hosted offering. Just before that, our system was partially malfunctioning for just under one hour on Saturday night. We want to apologize deeply for the trouble this caused on your end. We know that you rely on us to run your business, sell your tickets, handle check-ins and more. Every second of uptime counts, and we're truly sorry that we've let you down. In this post, we want to transparently share what happened in technical detail and what we're doing to fix it.
Incident of 2026-06-27
Timeline of events
On Saturday, around 18:30 UTC, we started to see network issues between our servers. This caused a short spike in failed page loads for two minutes because it caused our system to failover to a different database server. Following that, all pages were available again, but all asynchronous actions, which includes adding tickets to the cart or submitting orders, had a failure rate of 25 %:
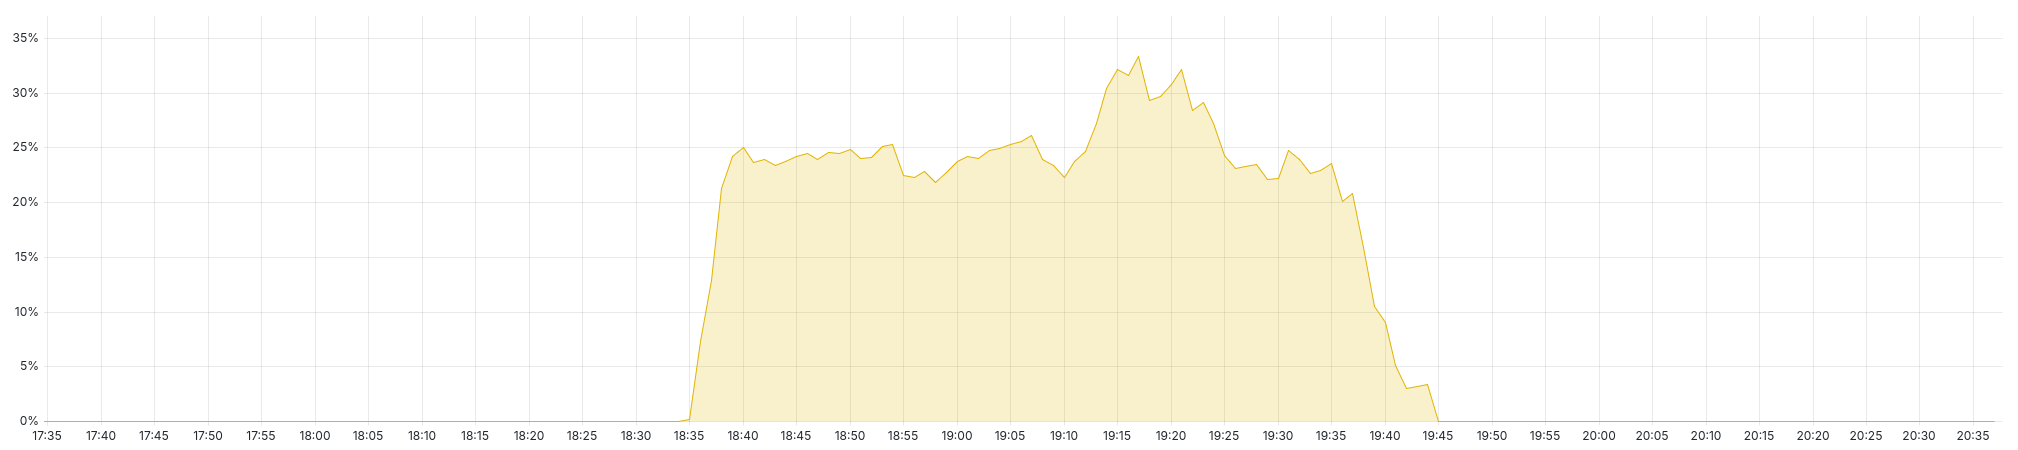
This means that when e.g. trying to add a ticket to the cart, 1 out of 4 times the user was presented with an internal server error, asking them to retry. With high likelihood, the second attempt worked.
Because most purchases still went through, it took until 18:53 UTC before our automated monitoring system detected it as a major outage and escalated it to our highest incident priority. At 18:57 UTC, the first engineer responded to the alert.
At this time, we were presented with a confusing situation, since some of our servers were able to talk to each other and others were not, with no obvious pattern. Our monitoring system was showing errors all over the place, since also our monitoring system was not able to reach all servers. We therefore quickly suspected a network issue at our data center provider. We did not understand how the failure rate came to be exactly, and we decided – since the system was still in a mainly usable state – not to try anything risky to avoid making things worse. We planned to restart all server processes, which might have helped, but the first attempt to restart them failed and by the time we noticed, the issue was resolved: At 19:38 UTC, all connection issues were gone. At 19:49 UTC, we were able to reach someone at the datacenter who confirmed that they were having issues previously and fixing the situation.
Root cause analysis & fix
To explain what happened, a very simplified view of our network looks like this:
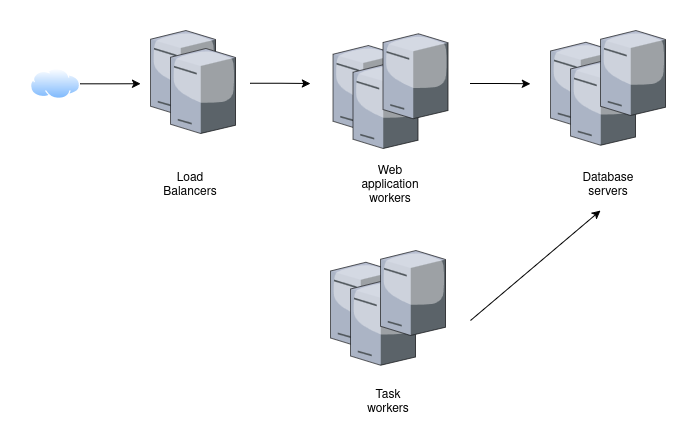
Our database cluster is running two types of databases, a relational database (PostgreSQL) and a key-value store (redis). Both use a clustering mode where one server is the "lead server" at all times, but if it fails, another server will automatically take over. For both databases, server 2 was the "lead server" at the start of the incident. When the network began to cause problems, the redis cluster decided to switch to server 3 as "lead server", because server 2 was no longer reachable by enough other servers. The PostgreSQL cluster, however, remained with server 2 as the "lead server", since it was no longer able to communicate between enough nodes to safely make a new leader decision.
The web application workers are responsible to answer your requests when you call our web page. Some of them continued to work because they could reach both database servers 2+3. Some of them stopped working because they neither could reach server 2 nor server 3. The load balancer automatically determines which web application workers are "healthy" and exclusively uses them. Since enough servers remained with access to both database servers, the web application was fully available.
The task workers are responsible to work on anything that can take longer than a web request and happens asynchronously. This includes cart modifications and order submissions, but also exports performed in the backend, sending of emails, generation of PDF, and many more features. These servers were suffering the same issue as the web application workers, but with different consequences. Some task workers were able to reach both database servers 2+3 and continued to work. Other task workers were no longer able to reach database server 3. Without redis, they are unable to know what tasks to work on, so they just stopped working – but also not causing any harm. Even other task workers were able to reach database server 3, and therefore be assigned a new task to work on, but then could not reach database server 2 for performing any actually useful work. Therefore, all tasks assigned to these workers failed. Since there were three times as many task workers that fully worked than servers with only access to database server 3, roughly 25% of incoming tasks failed.
We're not going to be able to stop being dependent on our data center providers to provide us with a network that is working reliably. While we engineer our systems in a way to be durable under many types of failures, every type of redundancy and multi-server setup requires the different components to talk to each other. Given the situation, we believe that the system worked quite well overall and showed good resilience. The only thing we could improve is that tasks should not be picked up by task workers without connection to the PostgreSQL database. We'll look into ways to accomplish this.
Incident of 2026-06-29
Timeline of events
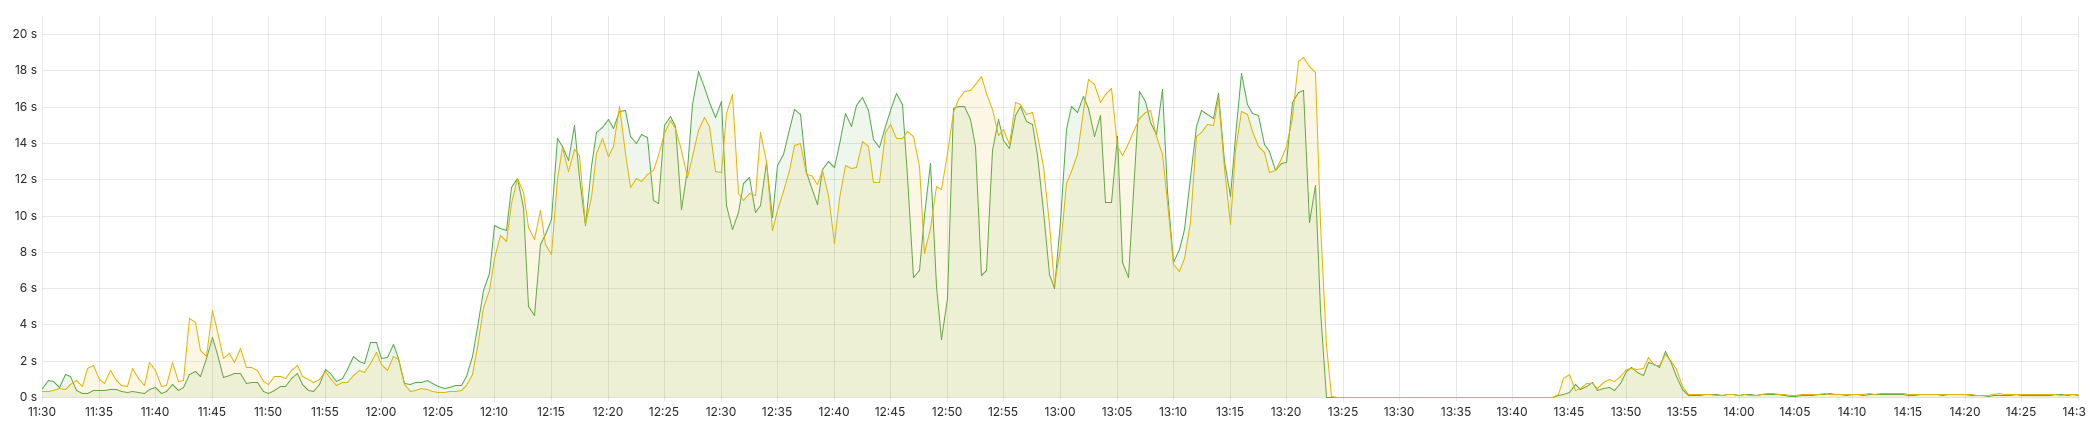
On Monday, around 12:07 UTC, our system started to slow down significantly across the board. Instead of our usual <1s average response time to all requests to our site, the average request time increased to well over 10 seconds:
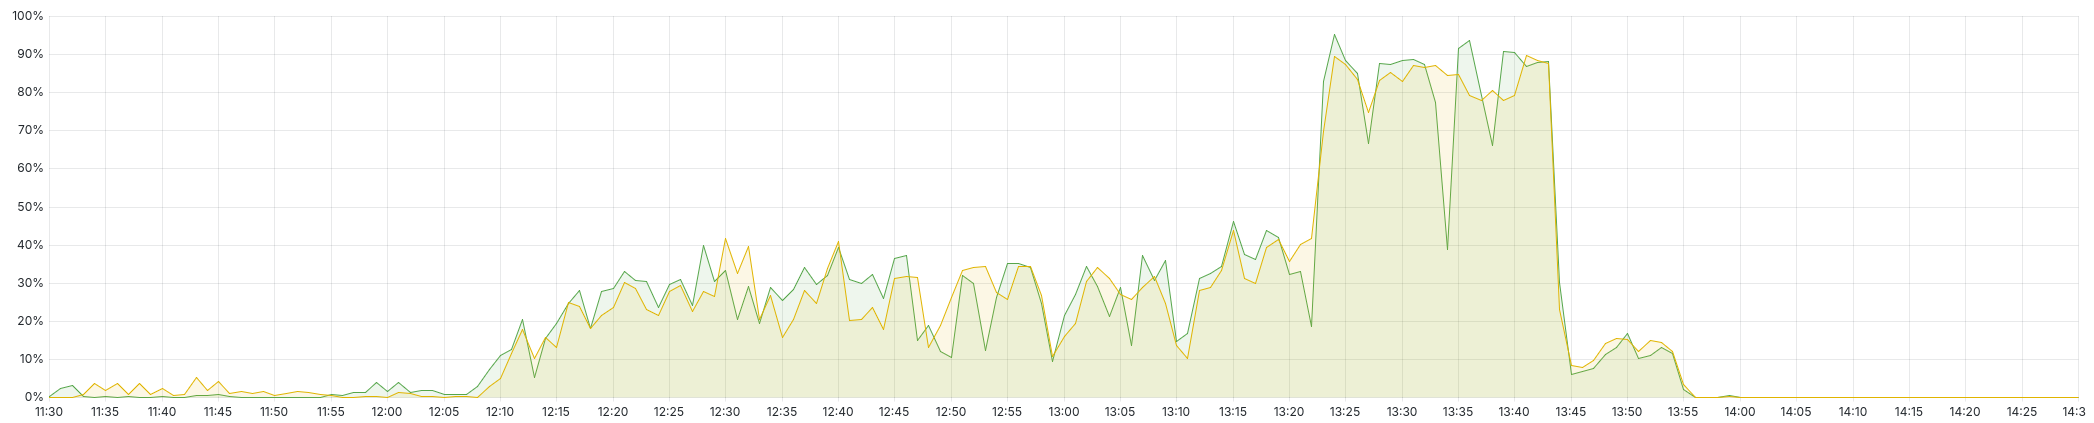
At the same time, a significant percentage of page loads, around 30%, started to end in error pages, mostly timeouts:
Around 12:11 UTC, our first internal users and customers noticed the issue, around 12:14 UTC our automated monitoring system raised the highest-priority alarm reserved only for full outages of pretix. At 12:17 UTC, our first engineer responded and started investigating the situation. By 12:45, we had a full team of four engineers looking into the issue.
Unfortunately, the situation was quite intransparent to us at first. There was a very high load on one of our database servers, but not on our primary one, with no significant increase in system activity to explain it. We first suspected a specific issue with this database server, restarted the database server and re-routed all queries, but that only shifted the high load to another database server. We then suspected an issue with the replication between our database servers and shifted all database queries to our primary database server, but that, again, only shifted the problem around without actually solving it. We noticed that the load was connected to very high disk usage and a set of similarly looking queries. We investigated samples of the queries and noticed that they were indeed using a large disk buffers (explaining the busy server) but were unable to identify a quick solution at first. One of the main problems in a situation like this is that any observation like "this operation is slow a lot" requires a lot of guesswork as to whether that is the cause of the performance issues or just a symptom that follows from the performance issues caused elsewhere.
At 13:22 UTC, we made the call to fully disable external access to the system to see if the load would recover without external requests and if that made it easier to find the root cause. Indeed, the system recovered to normal levels of load after a few minutes, and we noticed that the sampled queries we had looked at earlier were still running quite slow. This made it more probable that they were actually the cause of our issue, not the symptom. The query is used whenever the product list of a ticket shop is loaded, so many times every second.
At 13:44 UTC, we re-enabled external access, but enabled our visitor queuing system that we usually use for very high-load situations and limited each pretix customers to 50 shop visitors per minute to keep the load down. This caused system performance to be better than before, but still severely impacted.
At the same time, we noticed that over 3/4 of the analyzed slow queries occurred in the same ticket shop from the same customer. We decided to temporarily fully disable this shop and see if the performance of the system improved for everyone else. This was implemented at 13:48 UTC, and by 13:55 UTC, the system performance was fully back to normal.
We immediately reached out to the customer whose shop we disabled. By pure coincidence, one of our colleagues was in a hotel room just 10 minutes from their venue, so we met with them and apologized in person less than 15 minutes after we deactivated their shop. Since their venue was closed on the day, we agreed that we could take our time to find a proper solution. By 16:22 UTC we had developed a fix which went live around 18:30 UTC, after which we were able to re-enable their shop.
Root cause analysis & fix
During careful analysis of the affected queries, we noticed that we were constructing a SQL query that contained the following condition: Show only products where the number of quotas connected to the product is > 0. To evaluate this, the database did the obvious thing: Find all quotas connected to the product and then count them up. Crucially, the customer with the highly affected shop is our customer who currently has the highest number of dates in their event series with almost 30,000 timeslots. This has caused this query to become quite slow. Not terribly slow, still around one second of execution time under normal conditions, but – with an intermediate result that is written to the disk – causing a very high I/O load to the disk.
At the same time, they have started to attract a high number of shop visitors on Monday. Compared to previous days, their visitor count tripled in the morning:

We suspect that there are additional contributing factors to this issue raising suddenly, such as a difference in how the database query planner executes this exact query based on changes in the general dataset, but we're unable to fully understand that after the fact.
To make things worse, that part of the query is (mostly) useless in an event series. What matters in an event series is not if any quotas are connected to the product, but if any quotas of the selected date are connected to the product. This was correctly checked by the code but only later on the result of the query. As a fix, we have rewritten the query to perform the correct check which is significantly quicker and solved the issue.
Our monitoring, alerting, and escalation procedures worked well during this incident. What did not work well was our capability to quickly diagnose the correct issue. In fact, we had a correct rough hypothesis quite early on, but got distracted by alternative options and problems that made verifying the hypothesis much harder. As pretix grows in dataset size, we'll be unable to avoid a query that once ran quickly becoming an issue every once in a while. Going forward, as a result of this incident, we will develop better internal tooling to find these problems before they have high impact, and to recognize, analyze, and hotfix similar issues much more quickly when they do end up having impact.